
Strategic Thinking Techniques for Future-Ready Leaders
This guide is a companion to the blog post Getting Started with Visual Sensemaking: Strategic Thinking Techniques for Future-Ready Leaders. If you’re ready to move from insight to action, here’s how you can begin building your own small-scale, visual strategic map—no fancy software or design experience needed.
Visual sensemaking combines visual thinking techniques and strategic thinking techniques to help leaders navigate complexity with clarity and make better decisions faster. It’s a vital step in developing future-ready tech skills and enhancing digital literacy for employees across organizations.
📁 Overview: What Is Visual Sensemaking?
Visual sensemaking is the process of translating complex information, observations, and ideas into a visual format that helps you:
- See relationships and interdependencies
- Distill what’s essential from what’s noisy
- Surface patterns and gaps in your thinking
It draws on interactive visualization methods to turn scattered data into meaningful insights.
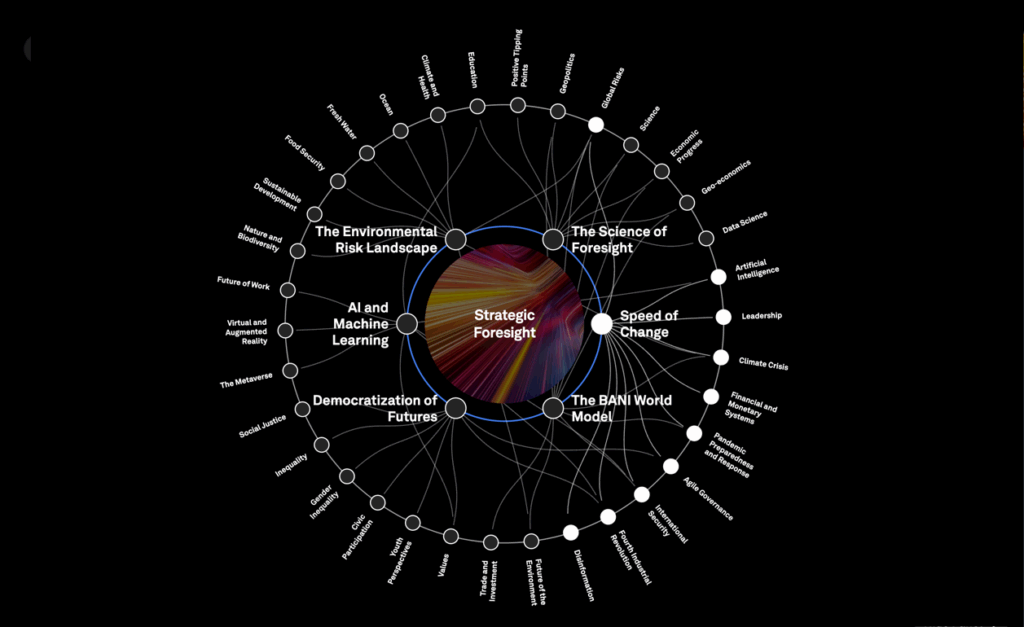
The World Economic Forum/Institute for the Future map is an advanced example, but you can start much smaller.
✏️ How to Start Small with Visual Sensemaking
1. Track What You’re Noticing (Or, Use Data You Already Have)
Start with a simple log of shifts, patterns, or tensions you’re observing—or pull from non-sensitive data you already track at work.
Sources could include:
- Articles you read
- Unexpected questions or moments of friction
- Workplace reports, dashboards, or informal metrics
You’re building raw material, not trying to solve anything yet.
2. Group by Theme or Tension
Are these signals:
- Technological?
- Organizational?
- Cultural?
- Emotional?
You might notice themes like “increased automation,” “loss of trust,” or “pressure to move faster.”
3. Sketch a Relationship Map
Use pen and paper, a whiteboard, or free/inexpensive digital tools like
- Kumu
- Excalidraw
- Nodeland.io
- Miro
- or even Google Slides.
⭐ Tip: Practicing with simple tools supports digital literacy for employees who may feel intimidated by complex platforms.
Place your observations as nodes. Draw arrows or lines to show how one influences another. Don’t worry about making it look polished—focus on meaning over appearance.
4. Label Meaningfully
Instead of vague labels like “Tech A” or “Trend X,” use specific, grounded language such as:
- “Rising skepticism around AI in education”
- “Increased pressure for 24/7 availability”
- “Middle managers overwhelmed by tool sprawl”
This keeps your map anchored in your lived experience and builds a stronger base for strategic thinking techniques later.
5. Keep It Iterative and Messy
This is a thinking tool, not a final deliverable. Return to your map weekly. Add to it. Redraw it.
Think of it as an evolving snapshot of how you’re interpreting change—a real-time reflection of future-ready tech skills at work.
💡 Example Use Cases

Leaders across industries are using interactive visualization methods to enhance decision-making, boost digital literacy for employees, and foster more agile strategic thinking.
- A department chair maps faculty anxiety, enrollment dips, and tech initiatives to decide how to frame next semester’s priorities.
- A founder tracks shifts in client needs, market language, and their own energy to decide where to simplify their offers.
- A team leader builds a shared sensemaking map during a retreat to clarify competing priorities and hidden connections.
📊 DIY Mini Sensemaking Map
Create your own map using Notion, GoogleDocs, Kumu, Miro, or mind map app. Use these prompts to start today:
1. What signals am I noticing?
- List at least 5 shifts, patterns, tensions, or surprises
2. What Themes or Clusters Are Emerging?
- Group by domain, tone, impact, or frequency
3. Sketch the System
- Draw or describe how these ideas relate. Who/what is influencing what?
4 Where Am I Being Pulled to Act or Reflect?
- What feels urgent? What feels stuck? What needs more clarity?
Take it all in. Allow it to settle. Go for a walk. Sleep on it and come back to it. You’ve planted the seeds for creativity and new ways of seeing! You’ve started building an essential 21st-century leadership skill.
Visual sensemaking is not about creating perfect diagrams—it’s about building the practices and skills that help you lead through complexity with creativity, confidence, and clarity.
✨Shape tomorrow with a repivot mindset today.✨