
This is Part 1 of 2 posts on adaptability, sensemaking, and visualization.
Most strategic plans don’t fail because of bad data. They fail because leaders can’t see the signal through the noise. In fact, up to 90% of change efforts break down due to poor sensemaking—yet fewer than 4% of leadership traits identified in a major MIT Sloan study address it.
I’ve been thinking a lot about what it means to make sense of change—especially after spending time with this visualization from the World Economic Forum and the Institute for the Future. It maps not just trends, but strategic intelligence: how different forces, pressures, and responses are entangled in a rapidly shifting world.
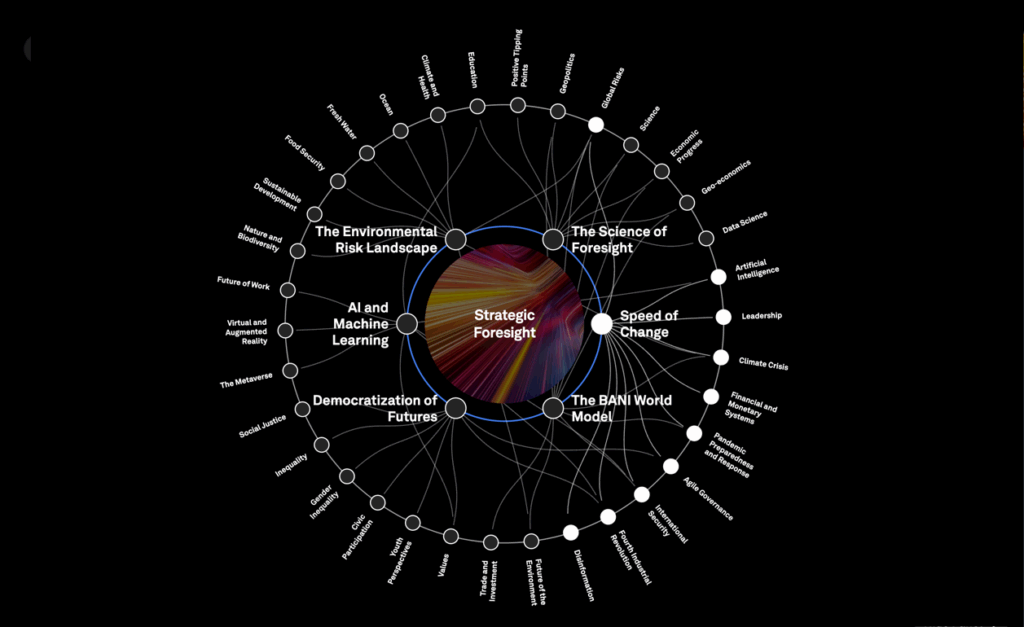
At first glance, it’s overwhelming. But look closer, and you’ll see something powerful:
This isn’t just a forecast. It’s a mirror of how modern professionals need to think.
From Complexity to Clarity
Today’s challenges don’t arrive in neat categories. They arrive as interdependencies: AI meets climate risk meets labor market shifts. Leadership and strategic vision through this requires more than expertise. It requires visual sensemaking: the ability to connect dots, zoom out, and see systems.
Interactive visualization methods, like the WEF/IFTF map, help leaders build the mental agility to spot patterns, manage complexity, and lead strategic change.
It shows:
- How technical literacy, upskilling, and education are not separate from strategy—they are strategy.
- How leadership now means interpreting volatility, not just reacting to it.
- How foresight isn’t about predicting the future, but preparing to move with it.
These are not innate talents. They’re teachable. But many mid- and late-career professionals haven’t had to work this way before.
What Happens When You Can’t See
Let’s make this real. Imagine:
A mid-career manager in tech
They’re juggling hybrid teams, shifting project timelines, and resource constraints. Without systems thinking, it’s all noise. By mapping patterns across projects, stakeholder groups, and internal workflows, they shift from firefighting to focused prioritization.
A nonprofit leader
Funders are changing focus. Community needs are evolving. But the team is stuck in reporting cycles that don’t account for dynamic shifts. A systems lens helps them reframe outcomes and communicate impact more clearly.
A faculty chair in higher ed
Faced with falling enrollment and uncertainty around AI’s role in teaching, they double down on what worked five years ago. Without strategic signals or a clear mental model, their response is reactive—and the gap between institution and reality grows.
In each case, the difference isn’t more information. It’s better interpretation.
The Upskilling We Don’t Talk About Enough
If you zoom into the visualization, you’ll find “technical literacy” and “upskilling” not as side notes, but as central elements of future-readiness. Not because everyone needs to code. But because everyone needs to navigate complexity.
We need to:
- Distill big systems into manageable visuals
- Ask better questions about cause and effect
- Spot early signals and adapt with less friction
Visual tools like this aren’t just helpful. They’re how we build shared language for uncertainty. It’s adaptation in action.
From Visualization to Vision

What this map reminds me is that being future-ready isn’t about certainty. It’s about capacity.
The capacity to:
- Pause long enough to see clearly
- Interpret patterns in a sea of noise
- Translate insights into meaningful pivots (pun intended)
And that’s not something you have to figure out alone. Future-ready tech skills can be learned. Practiced. Shared.
So here’s a gentle nudge:
- Take a few minutes to explore the visualization.
- Ask yourself: What do you recognize? What’s missing? What would you map for your own work?
✨ Build habits that last with a repivot mindset. ✨
👉 Up next: Part 2 of this series is a hands-on guide to getting started with your own signal map.